NOTES
FORTHCOMING ISSUES
| ISSUE (QUARTER) | Release Date |
| June 2007 | 28 September 2007 |
| September 2007 | 8 January 2008 |
ABOUT THIS PUBLICATION
This publication presents results from the March quarter 2007 Survey of Tourist Accommodation (STA) for the following categories of establishments:
- licensed hotels and resorts with facilities and 5 or more rooms
- motels, private hotels and guest houses with facilities and 5 or more rooms
- serviced apartments with 5 or more units
- caravan parks with 40 or more powered sites
- holiday flats, units and houses of letting entities with 15 or more rooms or units
- visitor hostels with 25 or more bed spaces.
INQUIRIES
For further information about these and related statistics, contact the National Information and Referral Service on 1300 135 070.
SUMMARY COMMENTARY
SEASONALLY ADJUSTED AND TREND
Hotels, motels and serviced apartments with 15 or more rooms
Key figures, Seasonally adjusted and trend - Australia |
|
 |  | Mar Qtr
2006 | Jun Qtr
2006 | Sep Qtr
2006 | Dec Qtr
2006 | Mar Qtr
2007 |
|
| Seasonally Adjusted |  |  |  |  |  |
 | Takings from accommodation ('000) | 1 632 140 | 1 680 990 | 1 685 748 | 1 785 694 | 1 806 882 |
 | Room occupancy rate (%) | 64.1 | 64.6 | 63.5 | 65.3 | 66.3 |
| Trend |  |  |  |  |  |
 | Takings from accommodation ('000) | 1 624 066 | 1 666 448 | 1 714 795 | 1 762 980 | 1 808 780 |
 | Room occupancy rate (%) | 63.7 | 64.1 | 64.4 | 65.1 | 65.9 |
|
Accommodation takings
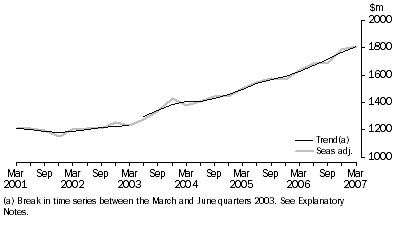
The trend estimate of the total accommodation takings for hotels, motels and serviced apartments with 15 or more rooms continued to increase. In March quarter 2007, it increased by 2.6% to $1,808.8 million compared with December quarter 2006.
In March Quarter 2007, the seasonally adjusted estimate of the total accommodation takings increased by 1.2% to $1,806.9 million compared with December quarter 2006.
ACCOMMODATION TAKINGS, Seasonally adjusted and trend - Australia

Room occupancy rate
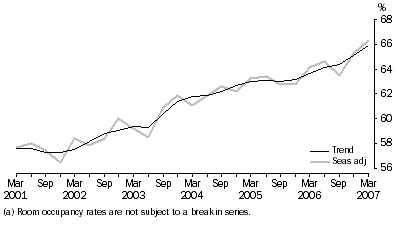
The trend estimate of the room occupancy rate for hotels, motels and serviced apartments with 15 or more rooms for the March quarter 2007 (65.9%) increased by 0.8 percentage points over the December quarter 2006.
The seasonally adjusted estimate of the room occupancy rate increased by 1.0 percentage point to 66.3% in March quarter 2007 compared to December quarter 2006.
ROOM OCCUPANCY RATE(a), Seasonally adjusted and trend - Australia

Seasonally adjusted and trend data are not yet available for hotels, motels and serviced apartments with 5 to 14 rooms or 5 or more rooms.
ORIGINAL
Hotels, motels and serviced apartments
The original estimates are impacted by seasonal variations and irregular or non-seasonal influences. Comparisons between quarters should be made with caution.
Key Figures, Original - Australia |
|  |
 |  | March
Quarter
2006 | June
Quarter
2006 | September
Quarter
2006 | December
Quarter
2006 | March
Quarter
2007 |  |
|  |
| Hotels Motels and Serviced Apartments with 5 to 14 rooms |  |  |  |  |  |  |
 | Rooms (no.) | 18 971 | 18 701 | 18 609 | 18 631 | 18 441 |  |
 | Room nights occupied ('000) | 798.3 | 739.7 | 758.3 | 792.3 | 785.1 |  |
 | Takings from accommodation ($'000) | 72 685 | 64 684 | 69 022 | 73 934 | 75 437 |  |
 | Room occupancy rate (%) | 47.3 | 43.9 | 44.4 | 46.7 | 47.9 |  |
 | Average takings per room night occupied ($) | 91.04 | 87.45 | 91.02 | 93.32 | 96.09 |  |
| Hotels Motels and Serviced Apartments with 15 or more rooms |  |  |  |  |  |  |
 | Rooms (no.) | 212 598 | 213 035 | 213 768 | 215 172 | 215 763 |  |
 | Room nights occupied ('000) | 12 225.5 | 11 748.7 | 12 829.8 | 13 161.0 | 12 833.8 |  |
 | Takings from accommodation ($'000) | 1 649 208 | 1 526 511 | 1 740 492 | 1 866 614 | 1 832 321 |  |
 | Room occupancy rate (%) | 64.2 | 60.9 | 65.3 | 66.9 | 66.6 |  |
 | Average takings per room night occupied ($) | 134.90 | 129.93 | 135.66 | 141.83 | 142.77 |  |
| Hotels Motels and Serviced Apartments with 5 or more rooms |  |  |  |  |  |  |
 | Rooms (no.) | 231 569 | 231 736 | 232 377 | 233 803 | 234 204 |  |
 | Room nights occupied ('000) | 13 023.8 | 12 488.3 | 13 588.1 | 13 953.3 | 13 618.9 |  |
 | Takings from accommodation ($'000) | 1 721 893 | 1 591 196 | 1 809 514 | 1 940 549 | 1 907 758 |  |
 | Room occupancy rate (%) | 62.8 | 59.5 | 63.7 | 65.3 | 65.1 |  |
 | Average takings per room night occupied ($) | 132.21 | 127.41 | 133.17 | 139.07 | 140.08 |  |
|  |
Accommodation takings
In March quarter 2007, accommodation takings for hotels, motels and serviced apartments with 5 or more rooms were $1,907.8 million. The average takings per room night occupied for these establishments were $140.08.
Accommodation takings for hotels, motels and serviced apartments with 15 or more rooms for March quarter 2007 were $1,832.3 million, at an average of $142.77 per room night occupied. For establishments with 5 to 14 rooms, accommodation takings were $75.4 million, at an average of $96.09 per room night occupied.
The contributions to accommodation takings in March quarter 2007 for hotels, motels and serviced apartments with 5 or more rooms were highest in New South Wales ($642.1 million) and Queensland ($475.0 million).
Room occupancy rate
The room occupancy rate for hotels, motels and serviced apartments with 5 or more rooms was 65.1% in March quarter 2007.
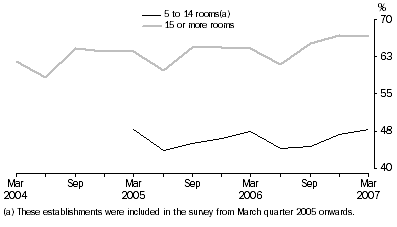
For hotels, motels and serviced apartments with 15 or more rooms, the room occupancy rate was 66.6%, while for 5 to 14 room hotels, motels and serviced apartments, the room occupancy rate was 47.9%.
Room occupancy rate, Original - Australia

Room nights occupied
Total room nights occupied were 13.6 million in March quarter 2007 for hotels, motels and serviced apartments with 5 or more rooms. Room nights occupied were highest in New South Wales (4.3 million) and Queensland (3.6 million).
For hotels, motels and serviced apartments with 15 or more rooms, room nights occupied were 12.8 million in March quarter 2007, while for establishments with 5 to 14 rooms, room nights occupied were 0.8 million.
Average length of stay
The average length of stay in March quarter 2007 for hotels, motels and serviced apartments with 5 or more rooms was 2.3 days. For establishments with 15 or more rooms, the average length of stay was 2.3 days and 1.8 days for establishments with 5 to 14 rooms.
Queensland (2.7 days) reported the longest average length of stay for hotels, motels and serviced apartments with 15 or more rooms, followed by Western Australia (2.6 days). The shortest average length of stay was in Tasmania (1.9 days).
Star grading
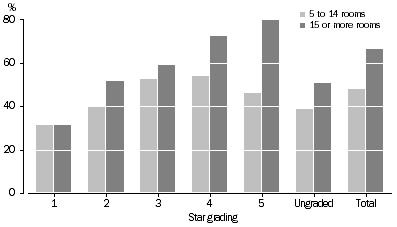
In March quarter 2007, the room occupancy rate for five-star hotels, motels and serviced apartments with 5 or more rooms was 79.5% compared with 31.5% for one-star. For hotels, motels and serviced apartments with 15 or more rooms, the room occupancy rate was 79.7% for five-star establishments compared with 31.4% for one-star.
For establishments with 5 to 14 rooms, four-star (53.9%) and three-star (52.6%) establishments had the highest room occupancy rates, compared with one-star establishments at 31.5%.
Room occupancy rate, Stargrading - March Qtr 2007

Caravan parks, holiday flats, units and houses, and visitor hostels
Key figures, Original - Australia |
|  |
 |  | Mar Qtr
2006 | Jun Qtr
2006 | Sep Qtr
2006 | Dec Qtr
2006 | Mar Qtr
2007 |  |
|  |
| Caravan parks |  |  |  |  |  |  |
 | Total caravan park capacity (no.) | 237 490 | 236 872 | 235 476 | 235 169 | 234 588 |  |
 | Nights occupied ('000) | 11 120 | 10 766 | 11 215 | 10 854 | 11 248 |  |
 | Site occupancy rate (%) | 52.1 | 50.2 | 52.5 | 50.3 | 53.5 |  |
 | Takings from accommodation ($'000) | 226 027 | 203 323 | 220 388 | 231 153 | 244 010 |  |
| Holiday flats and units |  |  |  |  |  |  |
 | Total units (no.) | 28 714 | 28 281 | 27 941 | 28 230 | 28 546 |  |
 | Nights occupied ('000) | 1 351 | 1 041 | 1 238 | 1 315 | 1 337 |  |
 | Unit occupancy rate (%) | 52.4 | 40.5 | 48.4 | 50.8 | 52.2 |  |
 | Takings from accommodation ($'000) | 156 184 | 108 196 | 140 168 | 157 995 | 161 209 |  |
| Visitor hostels |  |  |  |  |  |  |
 | Bed spaces (no.) | 48 042 | 47 732 | 47 405 | 46 631 | 46 770 |  |
 | Guest nights ('000) | 2 325 | 1 928 | 2 032 | 2 256 | 2 351 |  |
 | Bed occupancy rate (%) | 54.1 | 44.6 | 46.9 | 53.2 | 56.3 |  |
 | Takings from accommodation ($'000) | 53 337 | 45 136 | 49 155 | 55 751 | 57 361 |  |
|  |
Accommodation takings
In March quarter 2007, accommodation takings for caravan parks were $244.0 million, an increase of 8.0% compared with March quarter 2006. New South Wales ($94.4 million) had the highest accommodation takings for all caravan parks for March quarter 2007, contributing 38.7% of the total.
Accommodation takings for holiday flats, units and houses were $161.2 million in March quarter 2007, an increase of 3.2% compared with March quarter 2006. For visitor hostels, accommodation takings were $57.4 million, up 7.5% compared with March quarter 2006.
Occupancy rate
The site occupancy rate for all caravan parks in March quarter 2007 was 53.5%, an increase of 1.4 percentage points compared with March quarter 2006.
For holiday flats, units and houses, the unit occupancy rate was 52.2% in March quarter 2007, a decrease of 0.2 percentage points compared with March quarter 2006.
The bed occupancy rate for visitor hostels in March quarter 2007 was 56.3%, an increase of 2.2 percentage points compared with March quarter 2006. New South Wales (67.5%), Western Australia (62.7%) and Victoria (56.4%) had the highest bed occupancy rates for visitor hostels in March quarter 2007.
 Print Page
 Print All